Cardinal Investment Advisors establishes key leadership positions, appoints Marc Tourville as President and Stephanie Hebron…

Determining Whether Performance-Based Fees Create Value
By Sean M. Kane, CFA
Performance-based fees have existed for many years in both the alternative and long-only investment spaces. Performance driven compensation, primarily in the form of carry, is de rigueur in the private markets space. While alternative investors may have some influence on fee levels, they rarely have any influence on the broader performance-based fee structure. Yet in public market asset classes performance-based fees are commonly offered as a choice versus traditional asset-based fees.
Comparing Fee Structure Advantages
The relative merits of performance-based versus traditional asset-based fees are well discussed in industry literature. In short, performance-based fees can offer a better alignment of interests between investor and manager, focus on paying for alpha generation rather than beta, and improve investor economics when manager performance lags the appropriate benchmark. Asset-based fees, however, reduce the incentive for managers to take undue portfolio risks by removing what is essentially a free “call option” on excess return. Even under so-called “fulcrum” fee structures designed to create symmetry between up and downside risk for the investor, the lure of higher fees (and perhaps misplaced confidence in the ability to achieve them) may cause managers to depart from a mandate’s objective or intended risk profile in an effort to increase fees or recoup those unrealized from previous underperformance.
This brief paper does not intend to relitigate the comparative merits of these fee structures. Rather, we aim to demonstrate a technique with which an investor can directly compare performance-based versus traditional asset-based proposals – a typically opaque task given the number of variables and uncertainty around outcomes. How do we assist clients in choosing a fee structure when mandate size, asset class beta, a priori excess return, tracking error, graduated basis point fee levels, minimum/maximum fee amounts, and clawback/high watermark provisions (among others) must be considered simultaneously?
Using Simulation to Compare Fee Proposal Outcomes
Cardinal has developed a Monte Carlo driven simulation model that allows us to stochastically test various fee structures against each other. This framework allows us to not only consider an array of static variables but also the uncertainty around a manager’s performance and asset class growth.
We start with building a representation of the fee structures themselves or the “rules”. In a fixed, or deterministic scenario, the total dollar fees paid can be easily compared across fee structures at this point given static assumptions around market return, manager excess return, mandate size, etc.
What about under the uncertainty of real-world conditions and the paths that are created by them period over period? Running thousands of trials through a Monte Carlo simulation-based model that captures a distribution of results for these key variables much better informs the decision between performance-based and traditional asset-based fees.
Simulation Results
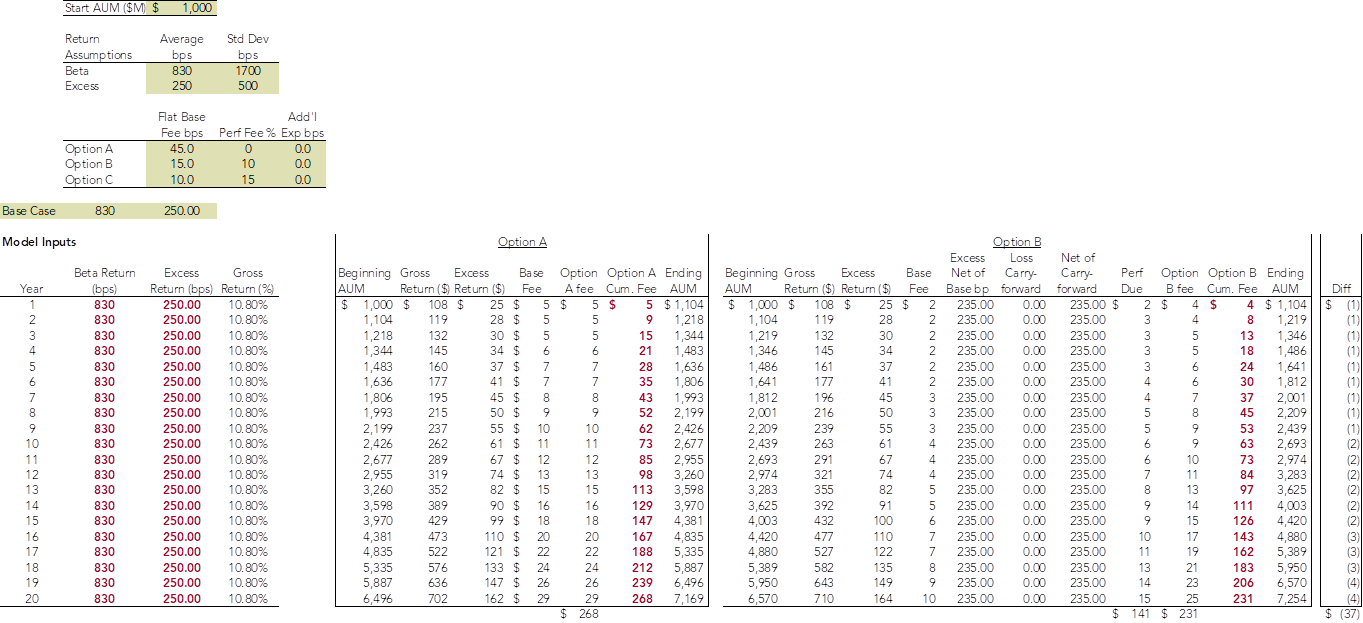
The exhibit below depicts the required inputs of the Monte Carlo-based stochastic model comparing a performance-based fee structure versus that of an asset-based fee. The conditional logic of loss carryforwards etc. must be carefully built out to reflect the correct waterfall of dollars trial by trial.
Exhibit 1
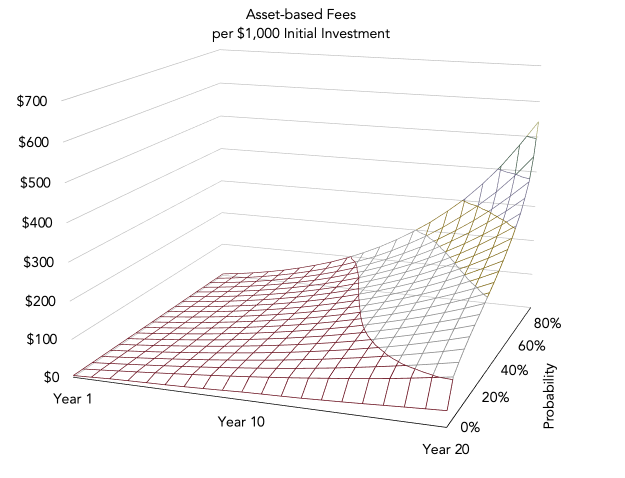
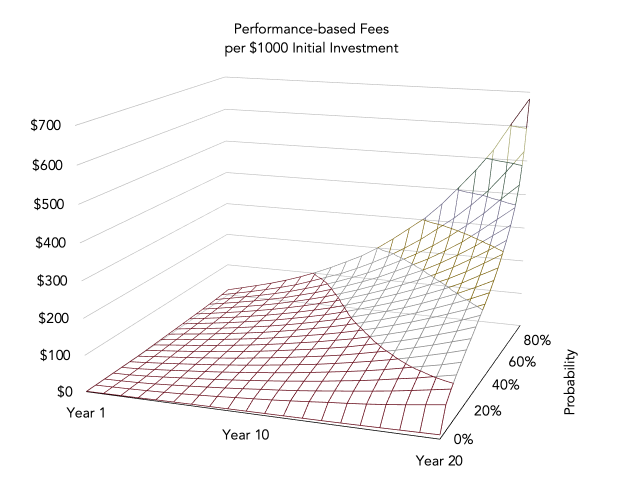
The model output captures the distribution of results of each fee structure, stated as total fee dollars paid over time as a cumulative probability density function mapped into a three-dimensional chart. The exhibits below show the distribution of results for each independent fee structure under consideration.
Exhibit 2
Exhibit 3
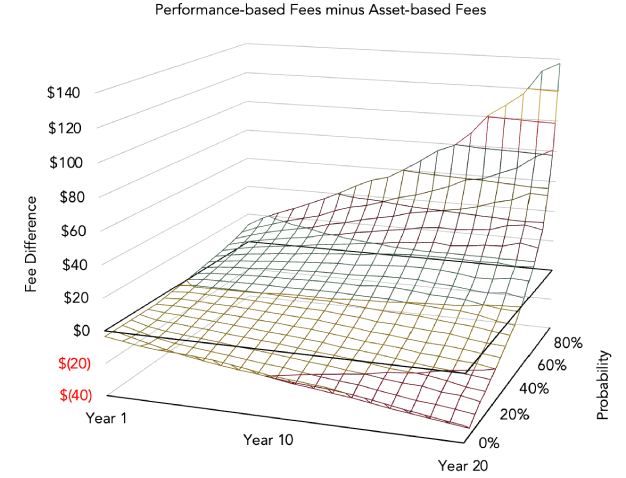
We can compare this output between option A – asset-based fee, and option B – performance-based fee, to determine the difference in total fee dollars paid over a period between the two proposals, as seen in the exhibit below. The investor can then determine which they favor based on their desired probability threshold. Often, one fee structure will “crossover” the other in an out year of the modeled projection period. This crossover is seen below as the probability of the performance-based option costing less than the asset-based option grows in the furthest outyears. In most outcomes, the performance-based fee option is more likely to be significantly more expensive.
Exhibit 4
An example of a real-world scenario’s modeled output could be represented in plain language as…
There is an x% chance that option A saves on cumulative fees through year 10 but a y% upside chance that option B saves enough on cumulative fees through year 15 to make them prefer that option.
There is no “correct” answer, merely a portrayal of the economic trade-offs.
If you would like to learn more, contact Cardinal Investment Advisors here.
Related Posts