We are excited to announce the promotion of Kevin Tucker to Director of IT. Kevin…

The Baseball Wasn’t Juiced – Inflation, the Fed, and Real Interest Rates
By Matt Padberg, Managing Director
In 2000, 5,693 homeruns were hit in Major League Baseball, up from 3,087 in 1980. Barry Bonds weighed 185 pounds in 1986 and stayed within five pounds of that through 1996, increased to 206 pounds in 1998, and reached 228 pounds in 2001. He hit a homerun one out of every 16 at bats from 1986 to 1997, then hit a homerun one out of every 9 at bats from 1998 to 2005. Numerous other sluggers of that era share similar stories. As a testament of our ability to see data and collectively look in the wrong direction, there were numerous reports during this time period alleging that “the baseball was juiced”.
Likewise, current concerns about inflation seem to miss the bigger and more disconcerting story. Recent inflation numbers are certainly elevated, caused in part by low inflation in 2020 and current supply chain challenges from Covid-19. While inflation expectations have accelerated compared to last year, they remain within established historical ranges based on US Treasury market yields.
Chart 1
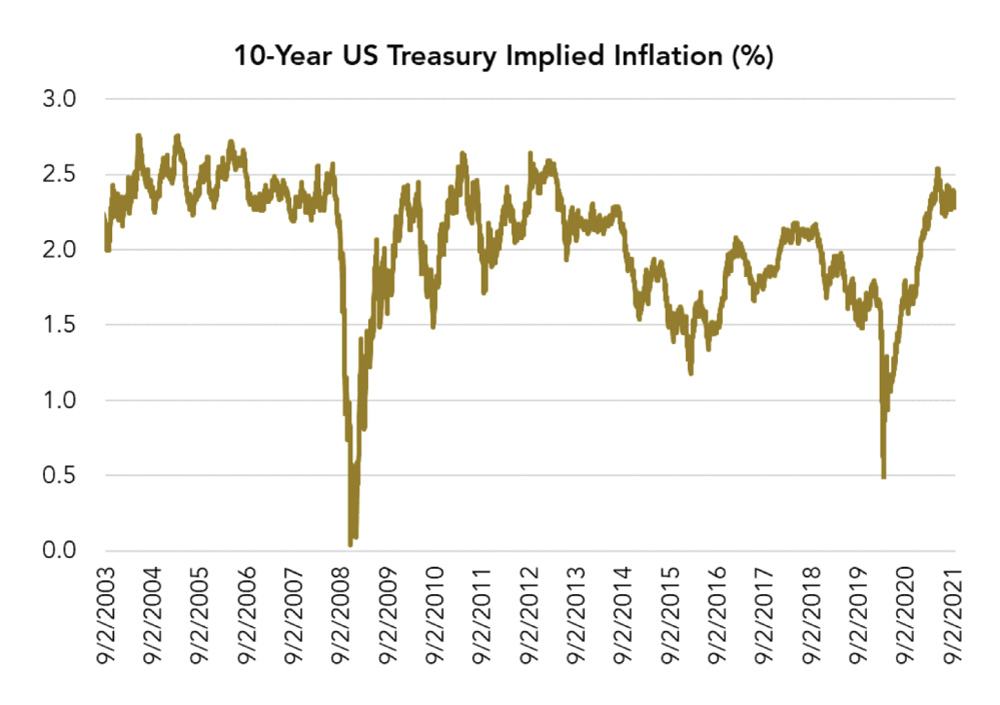
The more pressing concern, however, is low real interest rates. Nominal interest rates have been suppressed since the expansion of the Federal Reserve’s balance sheet in response to the Global Financial Crisis (GFC) in 2009.
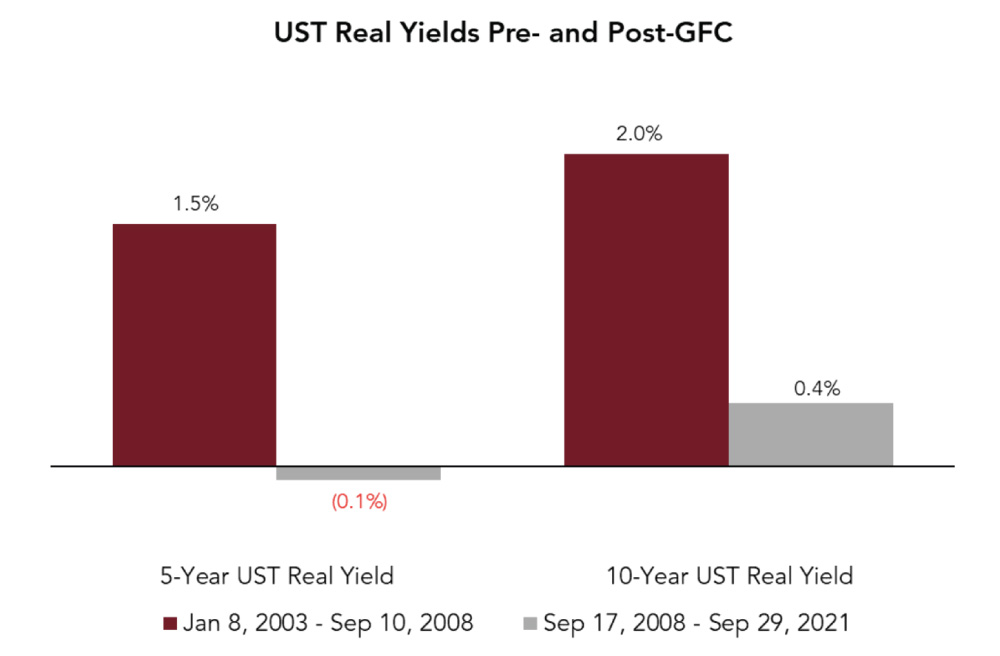
For well over a decade, investors in 5-year US Treasury bonds experienced negative real yields. Investors who could tolerate more duration experienced only 41 basis points of average real yield from 10-year US Treasuries over this same period. This is approximately a 160-basis point reduction in real yields between the two time periods, across tenors.
Chart 2
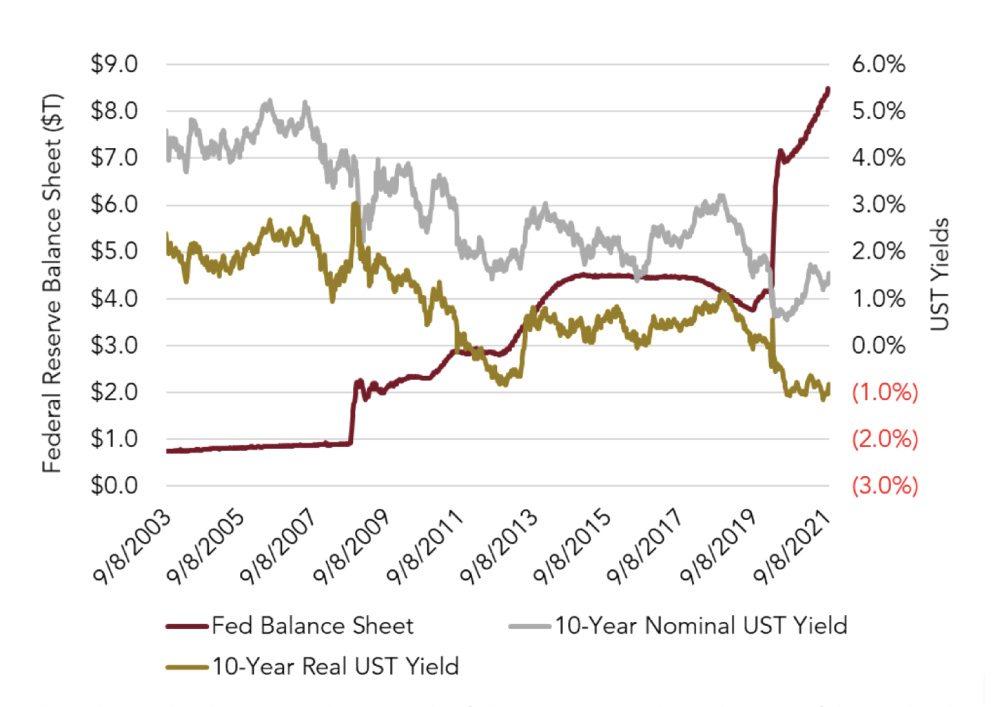
These outcomes seem to coincide with the increase in the Federal Reserve’s balance sheet as the Fed began buying bonds in response to the GFC.
Chart 3
This relationship becomes clearer in the following scatterplot. The size of the Federal Reserve Balance sheet explains 70% of the level of 10-year US Treasury real interest rates. While this drops to 44.0% if the pre-GFC data is excluded, this is still a compelling result for a single variable.
Chart 4
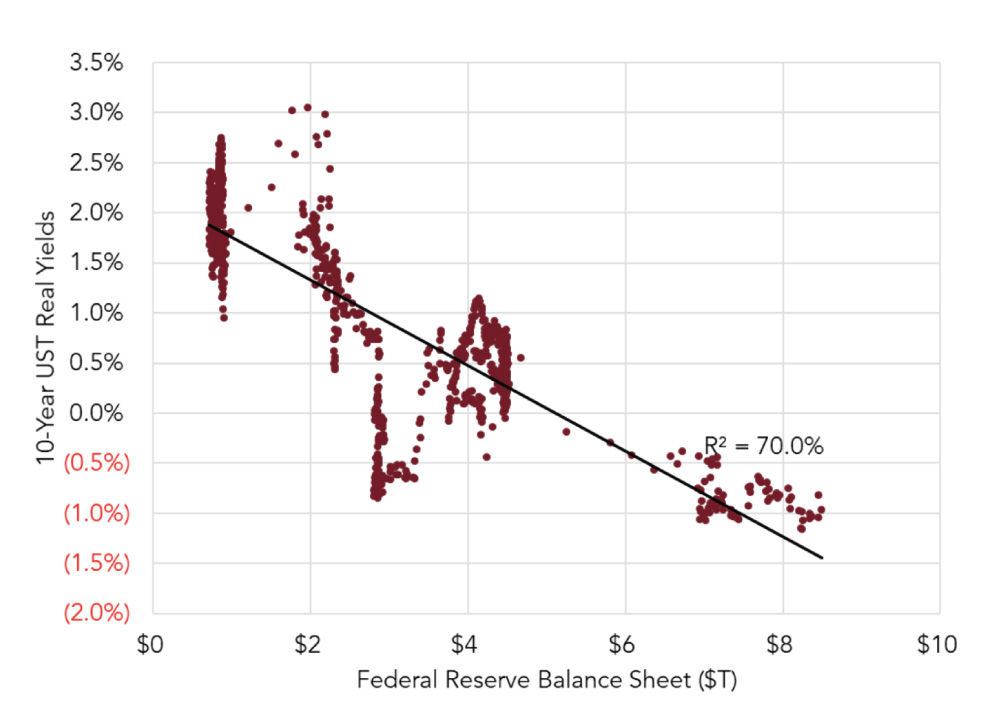
Before the GFC, the Fed’s balance sheet was below $1 T. It is now $8.45 T. Based on a regression line, 10-year US Treasury real yields went to 0% or below when the Fed’s balance sheet reached $5 T, as seen in Chart 4. The 5-year Treasury real yield went to 0% or below around $4 T (excluded from chart for brevity).
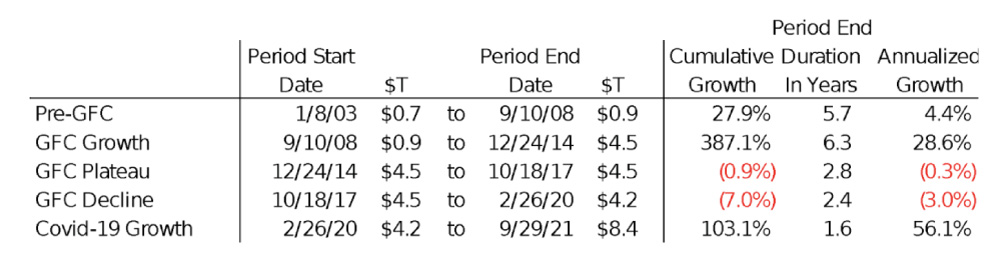
Looking at the solid red line on Chart 3 , the Fed stayed in the financial markets for a long time during the protracted recovery from the GFC. Disaggregating the Fed’s balance sheet into five periods helps parse out the data. Even when the Fed decided to reduce the size of its balance sheet, it only declined by 3% per year, which might indicate a lack of appetite to substantially exit markets.
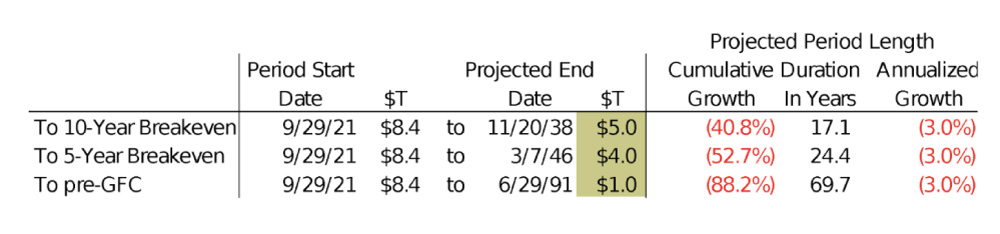
If the 3% rate of decline is indicative of how the Fed will behave in the future and we take the scatter plot above at face value, future real interest rates are worrisome. If the Fed were to reverse course today and start shrinking its balance sheet by 3% per year, real interest rates on 10-year US Treasuries would be negative for 17 years, real interest rates on 5-year US Treasuries would be negative for 24 years, and the Fed’s balance sheet would be above pre-GFC levels for nearly 70 years. These calculations assume that there is no further expansion of the Fed’s balance sheet in response to future economic crises, which seems optimistic.
Cardinal does not claim to predict the Fed’s behavior or the future path of interest rates; however, this analysis causes concern that low or negative real rates could be a reality for a protracted period of time.
While elevated inflation is a relatively new concern, industry can react and adjust to inflation by shifting production or purchasing patterns. Furthermore, some level of inflation can be beneficial. The Fed’s intervention in markets, on the other hand, has been impacting real rates for over a decade with no change in sight.
Reversing course at the Fed could be disruptive to valuations and the economy, which would require our leaders to demonstrate both strength of character and political resolve to focus on what is best for the long-term health of the economy. The past 13 years show that this is unlikely. For further proof, note that the Treasury Department continues to sweep all profits from Fannie Mae and Freddie Mac even though the mortgage crisis is a distant memory.
Even more worrisome, has the US economy gotten to the point that it only works with substantial government ownership of assets?
In our view, the risks which cause the most concern depend on your time horizon:
- Short term: inflation
- Intermediate term: negative real yields
- Long term: government ownership of assets
 Matt Padberg joined Cardinal in 2006. Matt’s primary responsibilities are client service and research. Prior to joining Cardinal, Matt worked for Transcend Financial Advisors performing turnaround and M&A consulting for small and large clients.
1. Capital News Service Maryland (www.cnsmaryland.org)
2. Time Magazine, “The Evolution of Barry Bonds”, July 4, 2007
3. www.baseball-reference.com
4. www.treasury.gov
5. This is based on comparisons of nominal and real US Treasury yields from www.treasury.gov.
6. www.fred.stlouisfed.org
7. While the government does not technically own the Federal Reserve, the US government receives the Fed’s profits and that feels a lot like ownership.
Related Posts